How to Invigorate Your Blog by Adding Visual Content
A company’s official blog should serve as the foundation of any content marketing efforts. Blogs are a great way to build relationships with current and potential clients. The tricky/difficult part is getting your blog noticed amongst the sea of blogs available to consumers today.
One of the best ways to get blog visitors to “stick” on your page is by quickly grabbing their attention – and there’s no better way to do that than with great, eye-catching visual content.
If your blog mainly consists of text-heavy posts, you should strongly breaking up the monotony by incorporating visual content into your blog. This not only adds some variety to your blog but also serves as a great way to more effectively engage your readers. Images and videos help to make your message easier and quicker to understand. Visual assets grab the reader’s attention and keep them coming back for more.
Here are some tips on how to incorporate different types of visual content into your blog so that your content marketing efforts attract and keep your readers’ attention.
Find an Excuse to Add Videos
For most people, videos are the easiest, most effective way to learn exactly how your product or service can solve a problem. Video can also be used to give experts or customers the opportunity to share their views on your product or the industry in general. Depending on the topic of your video, there are several different types that you can create and add to your blog. The most popular types of videos are interviews and webinars.
Interview Someone
Video interviews are a powerful way to share expert advice or allow your customers to share their perspective. While you can always type out an interview Q&A, a video interview is much more engaging and memorable, and far easier to follow. It’s also far more likely to be shared on social media (I mean, c’mon- when was the last time you hit “share” or “like” on a text-only interview?!). Videos allow viewers to connect emotionally with the subject of the interview, whether it’s an expert or a satisfied customer.
Let’s take a look at an example that proves the importance of incorporating visual content into your blog.

In this customer interview from Airbnb, a satisfied customer tells her story of how using Airbnb has helped her life. By filming this interview instead of simply typing it out, they allow viewers to really connect with the featured customer.
Host a Webinar
Webinars are a highly valuable piece of video content that could add a wealth of knowledge to your blog. Just because the webinar is over does not mean the content cannot be shared again. After recording your webinars, add the recordings to your blog with some high-level notes about what’s covered in the webinar. Not only will this help you to repurpose your webinar content, but it also gives more potential customers easy access to information about your product or service (not to mention that recorded webinars are SEO-rich).
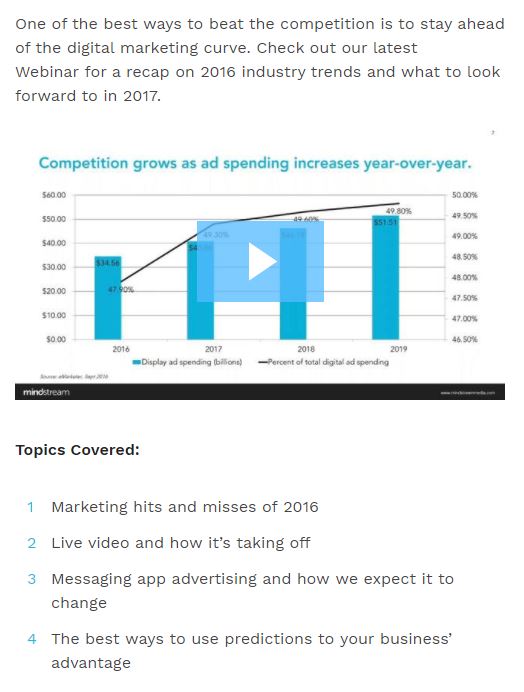
A great example of a webinar turned blog post comes from Mindstream Media. In this blog post, they include their most recent webinar along with the highlights that viewers can expect. This allows them to get more eyes on their webinar while also adding interesting and informative content to their blog.
Use Infographics to Tell a Story
If producing a video is not within your budget, an infographic might be the right type of content for you. Infographics take complicated facts, figures, and concepts and explain them in an easy-to-interpret combination of text and images. If the information for your post would be better represented by images, then consider creating an infographic to tell your story. There are various kinds of infographics that represent data in different ways. Find two of the most common kinds below.
Statistical Infographics
When you are trying to explain a data-heavy concept, a statistical infographic is a perfect vehicle to do so. This type of infographic helps to illustrate the story that your data is trying to tell. It also makes it easy to understand the impact and significance of the numbers at hand. One important tip for creating great statistical infographics is to make sure your data tells a story, use the data to help support the story, and use graphics to simplify data and relate it to the story.
This example of a statistical infographic comes from SmartMove. Notice how the numbers are the main star of the infographic, but they are supported by the accompanying imagery. While the numbers tell the story, the graphics make the data easier to understand.

Informational Infographics
The other common type of infographic is informational. Informational infographics are useful when your topic is not based on statistics but is simply giving readers more insight. Keep in mind that the purpose of an infographic is to use imagery to help readers digest information more quickly. If the information you are presenting is not enhanced by graphics, then your topic may make more sense as a regular blog post.
Let’s take a look at an example from VitaMedica. This informational infographic gives readers all the information they need to know while supplementing it with graphics. In this example, the images help the reader to quickly take in the information, which is the overall goal of the infographic.

Reusing Your Visual Content
Now that you’ve created this exceptional visual content, it doesn’t just have to live on your blog. A good content marketing philosophy states that you should repurpose any and all content by adding it to your social channels. The key to repurposing your content is understanding what content will work best for which channels. You shouldn’t just share the same content on your blog, Twitter, and Facebook. Instead, break up your blog content, and create smaller pieces of visual content to share on your social platforms.
It is important to remember that users digest content differently across each social platform. For example, videos work well on Facebook and Instagram but do not always convert well on Twitter. Additionally, users in different industries favor different platforms and types of content. Therefore, when preparing a visual campaign for social media, be sure to look at both the platform and how users in your industry (not all users) digest content.
Let’s look at an example of repurposing visual content and sharing it on your social channels. In this example from Community Tax, they created an infographic and shared it on their blog. Then, they used a portion of the infographic as an image and shared it on their Twitter.

It doesn’t take much to repurpose your visual content for your social channels. In fact, all Community Tax did was share part of the infographic. Just remember to keep your audience in mind when choosing how and where to reshare your content.
Conclusion
As you are planning your future blog posts, be sure to keep in mind different visual post options. Visual posts add interest, understanding, variety, and fun to any blog. More importantly, great visuals will generate more shares, more site traffic, larger audiences, and ideally, more conversions (and a stronger ROI for your content marketing investment).


